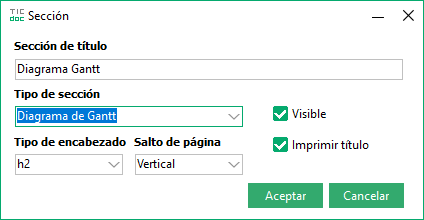
Gantt diagram
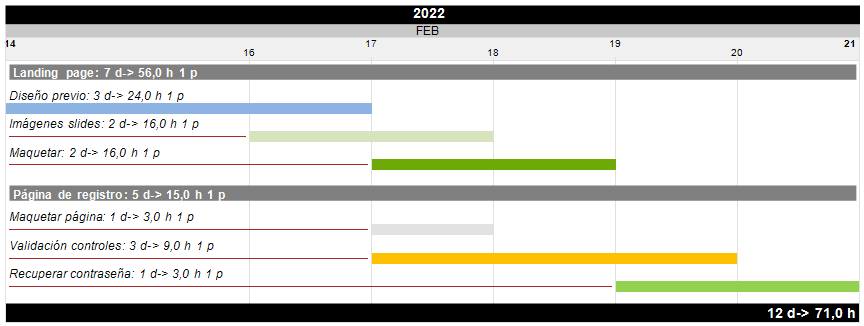
A Gantt chart is a type of bar chart used to illustrate the progress of a project over time. This progress is described by activities, which may or may not be included in a task. Each project activity is represented by a horizontal bar on the graph, and the vertical axis of the graph shows the time elapsed during the project. Bars stretch across the graph based on the duration of each activity, making it easy to see when each task starts and ends. The Gantt chart can also include dependency or relationship between tasks, as well as the number of people dedicated to each activity. Often used in project planning and tracking to help visualize the progress of the project and identify problems or delays.
This section has its own editor that we will open after adding a section with the Gantt Diagram type. We will add a new activity by pressing the insert button  (Ctrl + Insert) , we can select the task where
is included (it can be left empty), if the task is not registered, we write it in the list. Then we put a name to the activity, we indicate the start and end dates of it, a color to visualize it, the people dedicated and optionally if it depends on
Any previous activity that needs to be completed before this one can start. Additionally we can put a comment.
(Ctrl + Insert) , we can select the task where
is included (it can be left empty), if the task is not registered, we write it in the list. Then we put a name to the activity, we indicate the start and end dates of it, a color to visualize it, the people dedicated and optionally if it depends on
Any previous activity that needs to be completed before this one can start. Additionally we can put a comment.
In the upper right part of the editor we can define the percentage in width, which the diagram will occupy in the document.
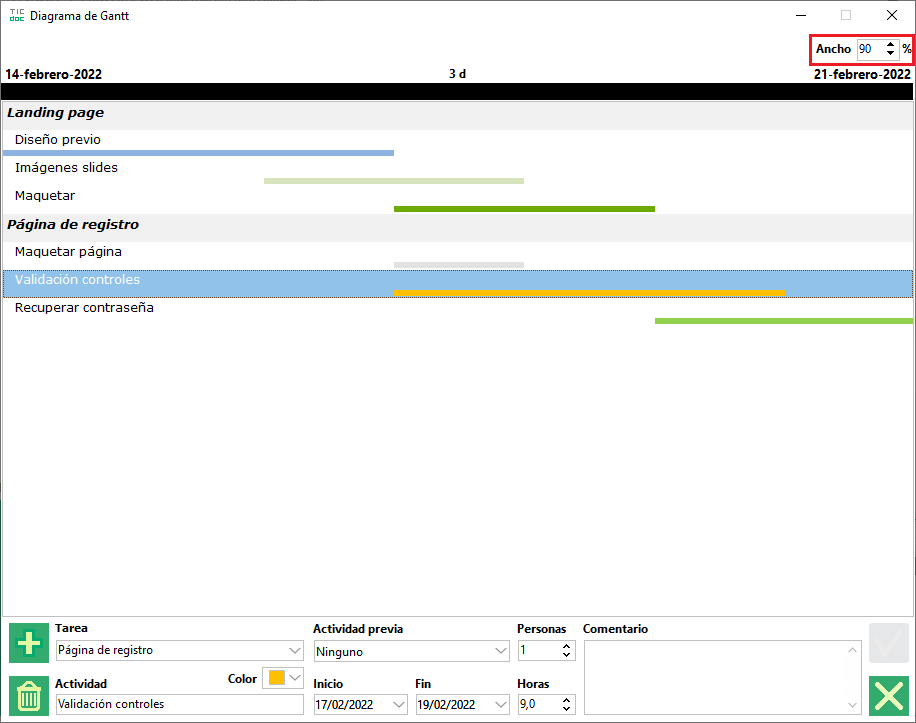
Gantt diagram editor.